In the new Windows Client, the main processes are the following. When Windows Client crashes, need to collect the crash information on the process.
- ClientShell.exe (32-bit)
- Windowclientshell.exe (64-bit)
When the crash occurs on Windows Client or Server Agent, we can use WinDbg to catch(capture) the call stack.
- Download and install WinDbg (https://developer.microsoft.com/en-US/windows/downloads/windows-10-sdk); during the installation, select the 'Debugging Tools for Windows' checkbox only. You can also download an old build from http://wcbuild.gladinet.com/releases/windbg/X86-Debuggers-And-Tools-x86_en-us.msi.
- For Windows Client/Server Agent, use 32-bit WinDbg if possible. The core components are a built-in 32-bit environment.
- After WinDbg is installed, copy SOS.dll
- The default x86 windbg is installed under "C:\Program Files (x86)\Windows Kits\10\Debuggers\x86"
- The x86 SOS.dll is under C:\Windows\Microsoft.NET\Framework\v4.0.30319\SOS.dll
- Copy SOS.dll from the Framework folder to the WinDbg installation folder. You can copy&paste in Windows Explorer directly. Or open a command prompt as Administrator and run either of the following commends
- copy "c:\Windows\Microsoft.NET\Framework\v4.0.30319\SOS.dll" "C:\Program Files (x86)\Windows Kits\10\Debuggers\x86"
- copy "C:\Windows\Microsoft.NET\Framework64\v4.0.30319\SOS.dll" "C:\Program Files (x86)\Windows Kits\10\Debuggers\x64"
- start WinDbg
- if the issue is on the Windows Client, start WinDbg as a regular user
- if the issue is on the Server Agent side, start WinDbg as Administrator
- Contact Support (ticket@gladinet.com) with the Windows Client or Server Agent version. We will send you the Symbol files corresponding to the software installed.
- Create a local folder C:\symbols, to store the symbol files downloaded from Microsoft (symbols from the Client can also be saved on this folder).
- The server agent only needs one symbol package, with a name like pdbxxxx.zip. Here, xxxx is the server agent version. For example for server agent version 12.3.3162.51136, the pdb file is pdb3162.zip. Unzip it. You will get the folder pdb3162\pdb, which contains the .pdb files. Thus the Server Agent's symbol path is: srv*C:\symbols*https://msdl.microsoft.com/download/symbols;C:\symbols\pdb3162\pdb
- Windows Client is using ClientShell. exe. Need both the symbol for the corresponding Triofox and the Windows Client/Server Agent symbol.
- Windows Client symbol is the same as Server Agent. You get a symbol file like pdb3162.zip. Unzip to get the folder pdb3162\pdb
- Triofox Server symbol file has the format of gcpdbxxxx.xxxxx. For example, for Triofox 12.3.9434.51139, the symbol file name is gcpdb9434.51139.zip. Unzip it to get a folder like gcpdb9434.51139\pdb9434. Can find the folder ClientShell, which contains pdb files
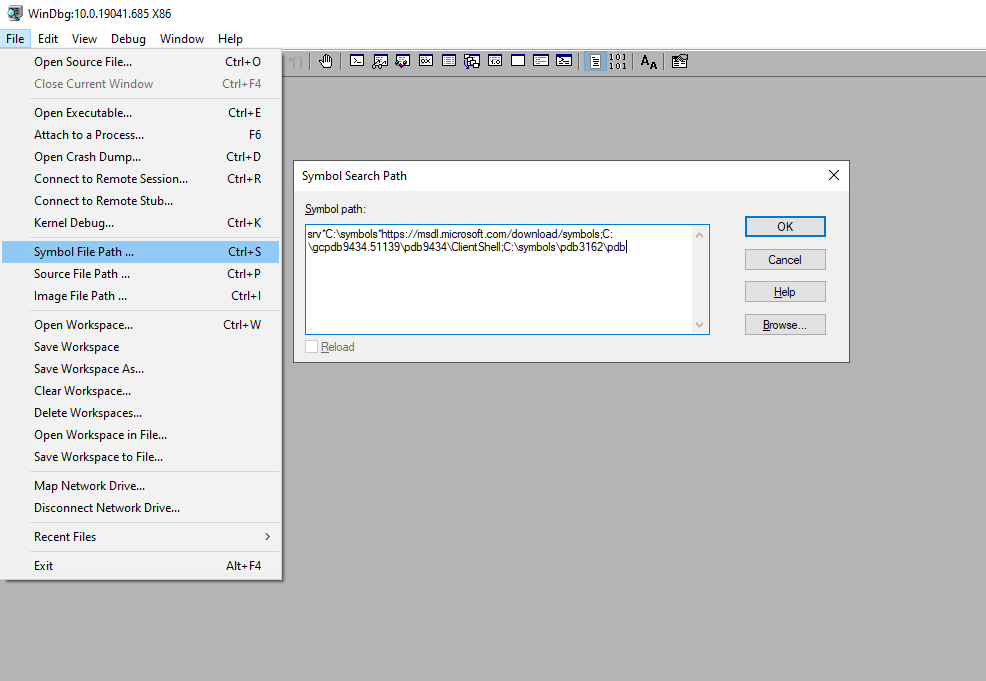
- The full windows client symbol path is: srv*C:\symbols*https://msdl.microsoft.com/download/symbols;C:\gcpdb9434.51139\pdb9434\ClientShell;C:\symbols\pdb3162\pdb
- From the WindDbg go to 'File' -> 'Symbol File Path', set the symbol path to the symbol path collected above
- Windows Client:
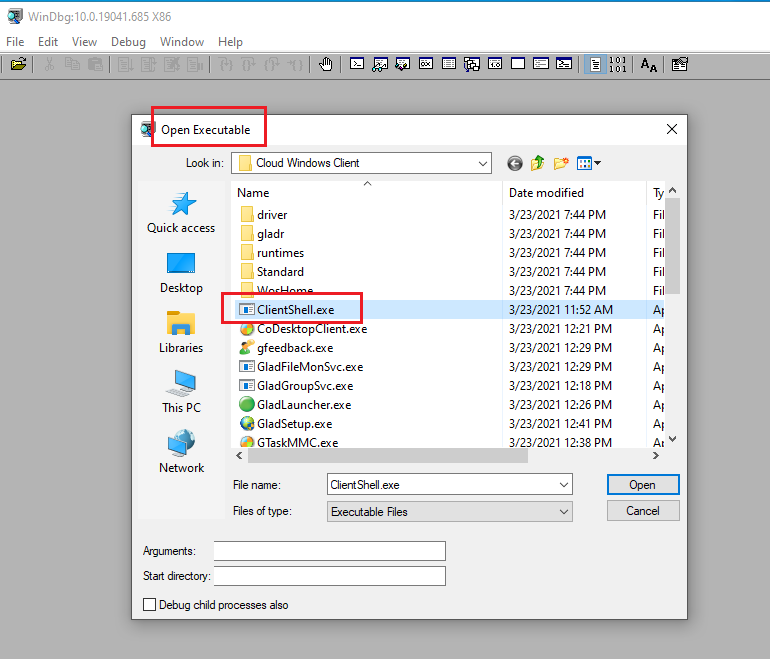
In WinDbg, go to File, Open Executable. Go to the Windows Client installation folder and select 'ClientShell.exe'. Click 'Open', to launch the Windows Client in WinDbg.
When starting Windows Client like this, do NOT start WinDbg as administrator first.
- Server Agent:
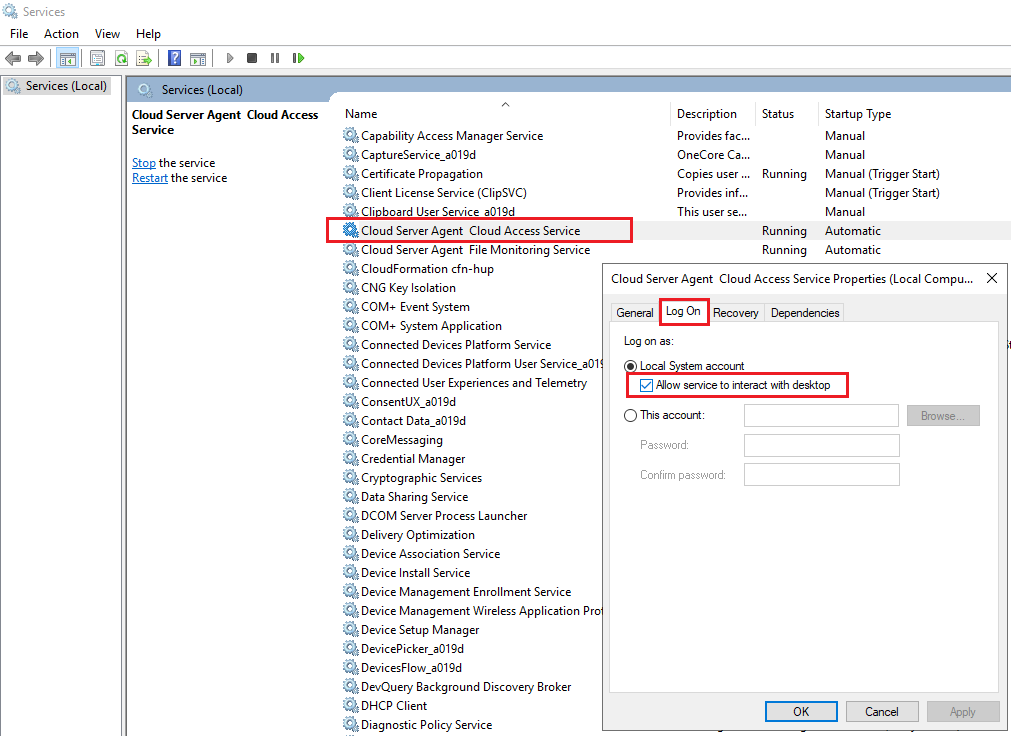
Go to Windows Services, find Cloud Server Agent Access Service, right-click and go to Properties, open the Log On tab, here enable 'Allow service to interact with desktop' (disable this after collecting the traces). Press Ok
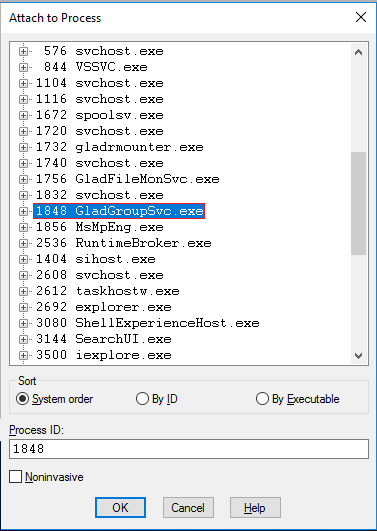
In WinDbg, press F6, select the process 'GladGroupSvc.exe' and click 'OK'. It will attach WinDbg to the process.
- On WinDbg command input line, run 'x kernel32!TerminateP*'. It returns the exact name of the TerminateProcess function. For example:
0:090> x kernel32!TerminateP*
776289b0 KERNEL32!TerminateProcessStub (<no parameter info>)
Here, the function name is 'KERNEL32!TerminateProcessStub'
Run 'bp kernel32!TerminateProcessStub', to set a breakpoint on the call 'kernel32!TerminateProcessStub'. This way, we can get all the thread information, instead of only one thread.
(In some machines, the function returned via x is 'KERNEL32!TerminateProcess'. In that case, set the breakpoint for the function via 'bp KERNEL32!TerminateProcess')
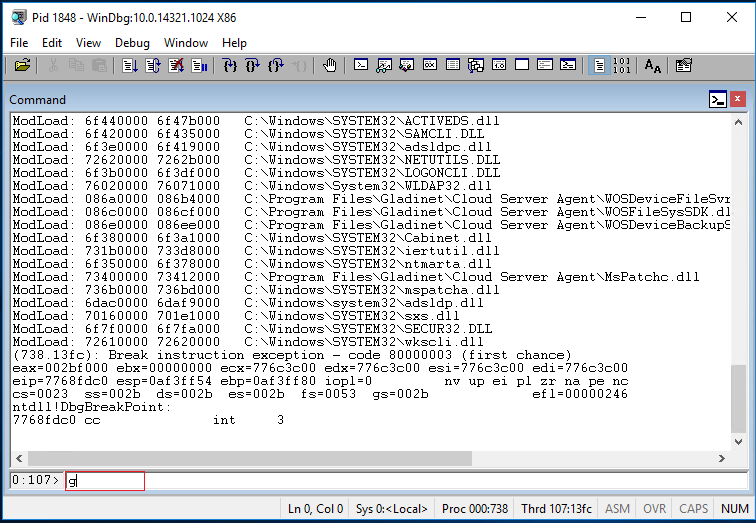
- Type 'g' to continue. The command line field will show '*BUSY* Debuggee is running…'.
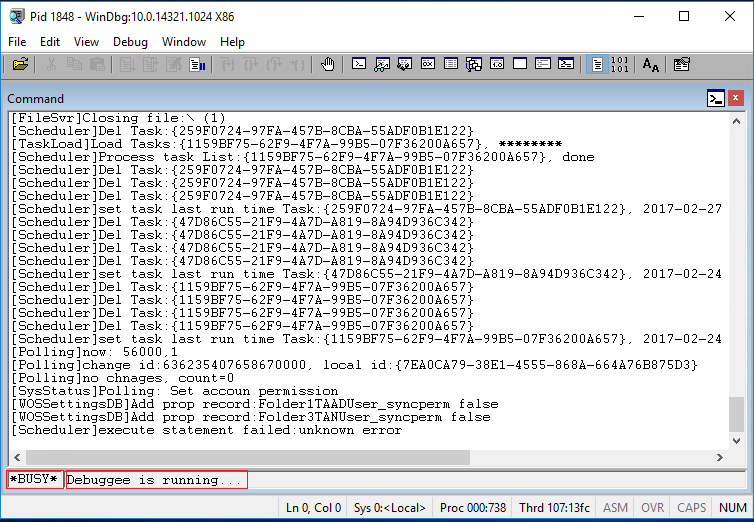
- If the Windows Client/Server Agent crashes, it will crash in WinDbg. Windbg will no longer show '*BUSY*'. The command line is ready to take command, to analyze the crash.
- The crash may be memory-related. Open windows task manager. Go to the Details tab. Here, enable the Columns 'Commit size', Handles and Threads.
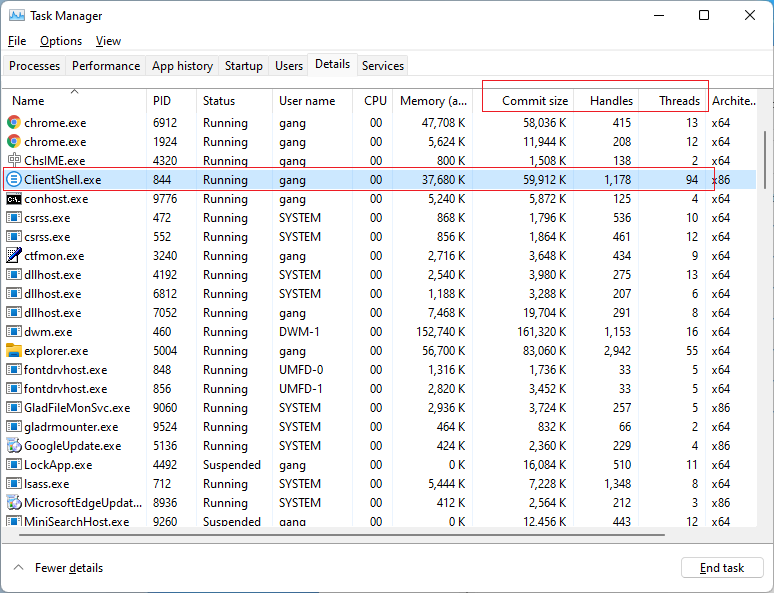 Take a screenshot.
 - If you are running 64-bit Windbg, run '!wow64exts.sw' first
- Run
-
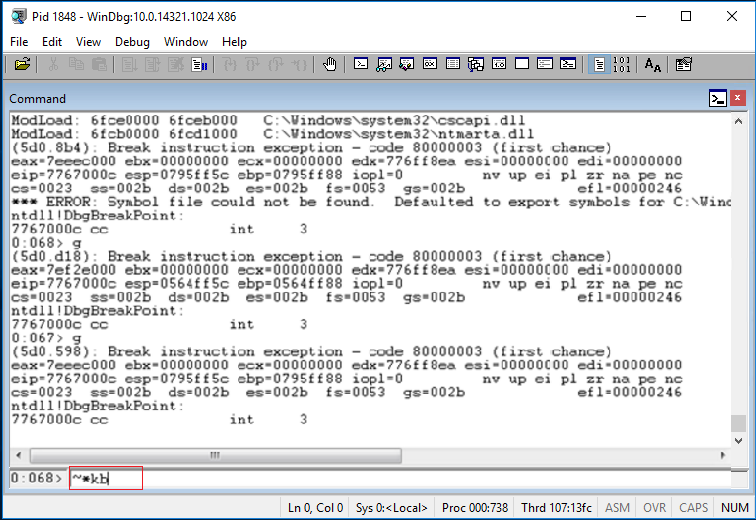
- kb
- ~*kb
-
- If the process is Windows Client (ClientShell.exe), run
-
- .load SOS.dll
- ~*e!ClrStack
-
- Type '!dumpheap -stat'
- Type '!analyze -v'
- Finally, save the output in WinDbg (Edit -> Write Window Text to File)
- Type '.dump /ma c:\temp\crash.dmp', to create dump. The dump file will be created under c:\temp. If the folder doesn't exist, please change the path. Zip the dump file and keep it, in case we need to retrieve more info from the dump.
- Now you can close WinDbg.
- Send the saved output and the dump file (if requested) to Gladinet support.
Comments
0 comments
Please sign in to leave a comment.